AI 1,955 views on YouTube
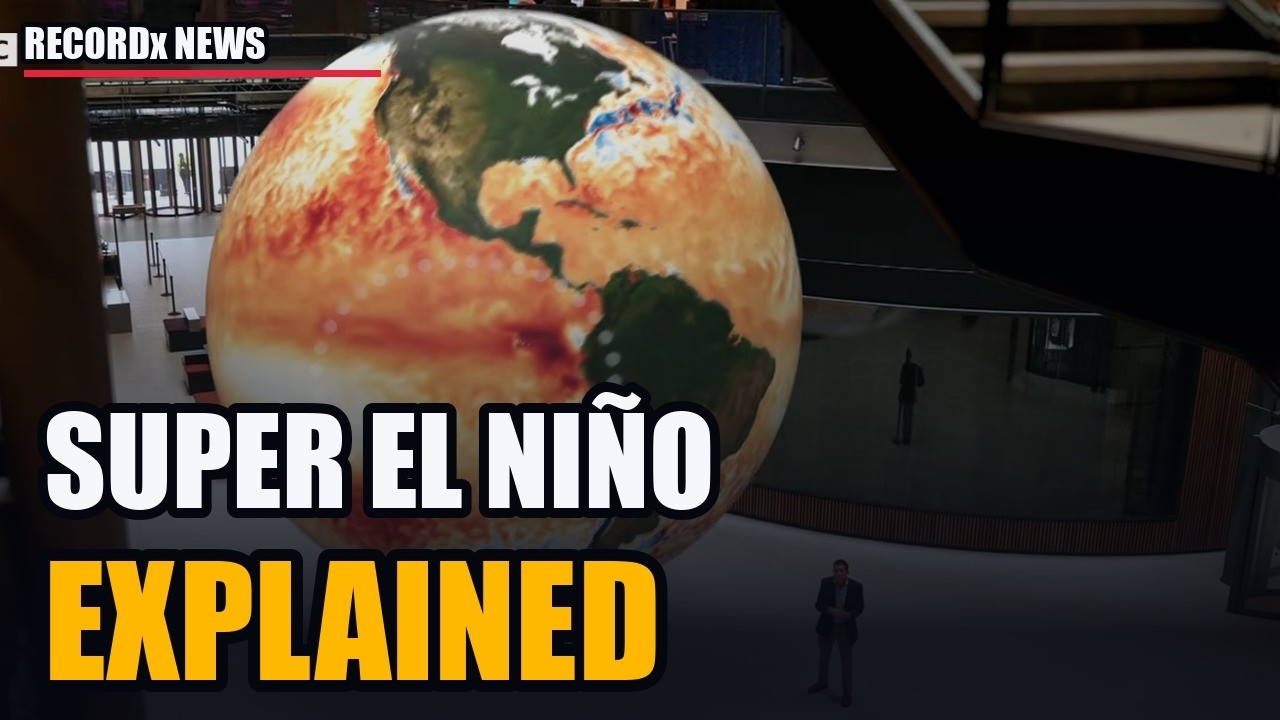
Super El Niño, Explained: What It Is and Why This One Is Different
The Met Office says the El Nino now forming will be the strongest in living memory. This is what that actually means: how El Nino works, where the line between strong and super sits, why the forecast kept climbing all year, what it does to rain, food and shipping, and what the planet's extra 1.4C of background warming does to the whole picture.
0:00 Opening 0:12 1. What El Nino is 1:01 2. When it becomes super 2:15 3. The forecast they doubted 2:51 4. What it does 3:39 5. Why this one is different
The claim (one claim, per series law)
The El Niño now forming was called in March, by a single model everyone dismissed — and the ocean has been chasing that outlier ever since.
News hook = Met Office, 21 Aug: strongest El Niño in living memory, peak >3 °C in November, 2027 "very likely" the hottest year on record. Spine = the prediction timeline. Payload = what it already costs (monsoon, Panama, food).
Why now
- 21 Aug 2026 — Met Office public warning + Prof Adam Scaife on camera (BBC).
- 22 Aug 2026 — DW interview with Liz Bentley (RMetS/EMS) puts the 1877 comparison on record.
- Story is not trending on X (checked 22 Aug: X GLOBAL/US/IN top terms are football, anime, wrestling;
trends/term/"el nino"has no X series). It IS moving on YouTube news: BBC 459k views in ~24h, DW 258k same-day, Vox 857k. Treat as a YouTube-native story.
First prediction — the spine (all dates 2026)
The line the short is built on: in March the ocean read +0.03 °C, the official odds were 9 %, and one model said four degrees. Five months later the ocean is at +2.7 and the outlier is the consensus.
How this was verified — the rest of the fact sheet
Footage inventory (all date-checked 22 Aug)
Gaps to source: Panama Canal current footage, Indian monsoon 2026, Peru fishing. Try the Bloomberg piece first before any new download.
Open calls (need answers before cutting)
- Second source for +2.7 °C week of 12 Aug and for CESM1 ~4 °C in March (CPC weekly / NMME March archive). Both are on-screen numbers.
- Short only, or short + a 16:9 doc later (the timeline has enough for a 5-minute NewsDoc)?
VERIFICATION UPDATE — 23 Aug
Both held numbers resolved; the chart is now built on primary NOAA data, not a screenshot.
References
Reporting drawn from Met Office / BBC News (21 Aug 2026) - DW News (22 Aug 2026) - NOAA Climate Prediction Center weekly Nino indices - IRI ENSO Quick Look (19 Aug 2026) - Zeke Hausfather · The Climate Brink (13 Jul 2026) - ECMWF (10 Apr 2026) - Bloomberg Originals - Vox
What the reel says
Transcribed from the published reel.
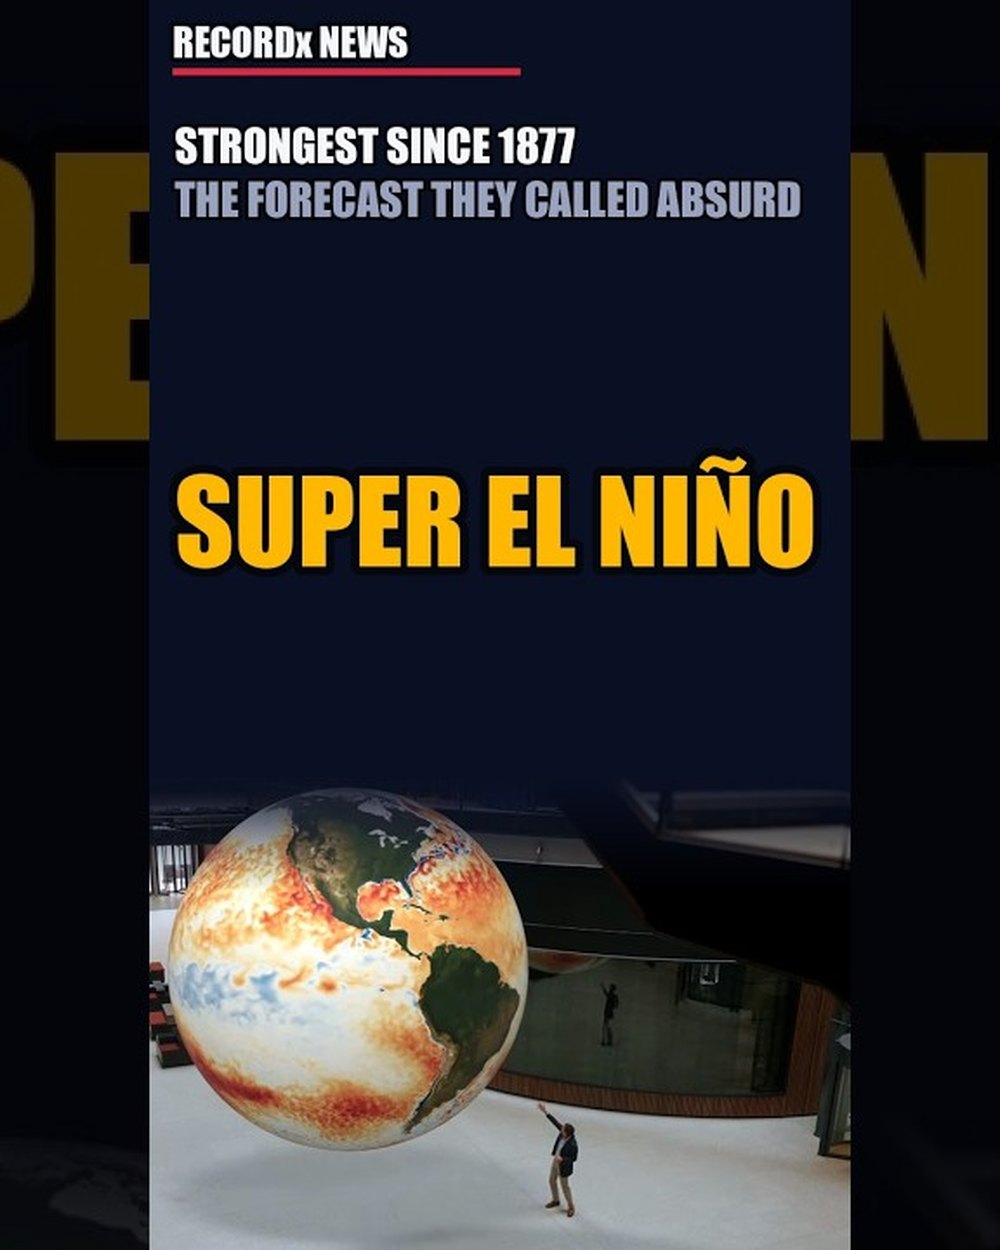
This is the strongest El Nino the world has measured in living memory. Here is what El Nino actually is. What makes this one super and what it is already doing to the planet.
Start with the wind. Along the equator, the trade winds blow from east to west, and they have done it so reliably that sailing ships were named after them. Those winds push warm surface water across the Pacific and pile it up near Asia.
When the winds weaken, that pile slides back east. Warm water spreads across the middle of the ocean, and the atmosphere follows it. That is El Nino.
El Nino is one half of a cycle scientists call ENSO. La Nina is the cool phase. El Nino is the warm phase.
And the swing repeats every two to seven years. The measurement is simple. Forecasters watch one box of the Central Pacific called Nino 3.4 when it runs half a degree above average and El Nino is declared.
Half a degree is only the entry point. One and a half degrees is a strong event. Two degrees is what forecasters call very strong.
And that is where the word super gets used. In the week of August 12th this year, that box measured 2.7 degrees above average. Off the coast of Peru, the water was four degrees above normal.
The peak is still months away. Underneath the surface, there is a second engine. A slab of warm water called a Kelvin wave has been traveling east across the Pacific, 9,000 miles long, and in places 7.5 degrees warmer than average for that depth.
As it moves east, it rises toward the surface and keeps feeding the event. That is part of why this El Nino kept beating its own forecasts. Only a handful of events have ever reached this class.
1877 peaked near 2.7 degrees and brought famine across India and Asia. 1982 brought drought to nearly every continent. 1997 brought floods, mudslides, and coral bleaching.
2015 set the modern record at 2.75 degrees. And I have never seen an event like this in our forecasts. The tropical Pacific is warming faster than I've ever seen.
The forecast itself is a story. In March, the Pacific was flat. NOAA's weekly reading sat at zero, and the official outlook gave El Nino a 9% chance for the spring.
One model, run by the American Center NCAR, projected a peak near 4 degrees. Scientists called that unrealistic. Every month after, the model average climbed.
2.8 in March, 3.6 by July, and the ocean ran ahead of all of them. A warm central Pacific moves the rain. Where it normally falls, it stops.
Where it rarely falls, it pours. Australia and Indonesia turn dry and burn. India's monsoon weakens, and this year it already has.
Peru and Ecuador flood. Southern Africa dries out. The southern United States turns wetter and stormier through winter.
That rearrangement has a price. The Panama Canal runs on rainfall, and when its lake drops, the canal limits how many ships can pass. West African cocoa is already showing damage, and that reaches your chocolate next year.
Economists put the cost of the 1997 event at $5.7 trillion, spread across the five years after it ended. We haven't seen an El Nino event like this since 1877 and we saw famine taking place during that last El Nino event so tens of millions of people died because crop failure happened across India, across South East Asia. Here is what separates this event from 1877.
The planet underneath it is already about 1.4 degrees warmer than the pre -industrial era. A super El Nino adds roughly 2 to 3 tenths of a degree on top of that, and only for a while. The background warming is the permanent part.
El Nino is the shove that pushes the world past its own records. Forecasters expect the peak in November and December. The Met Office says more than 3 degrees.
25 of 26 models now place this event in the very strong class, and 15 of them reach 3 degrees or higher. The Met Office says it is very likely that 2027 becomes the hottest year ever recorded. El Nino is natural.
The heat it lands on top of is not. That is why this one matters. Like, share, subscribe, and keep watching.